
| Every tax is a pay cut. Every tax cut is a pay raise. |

|


|
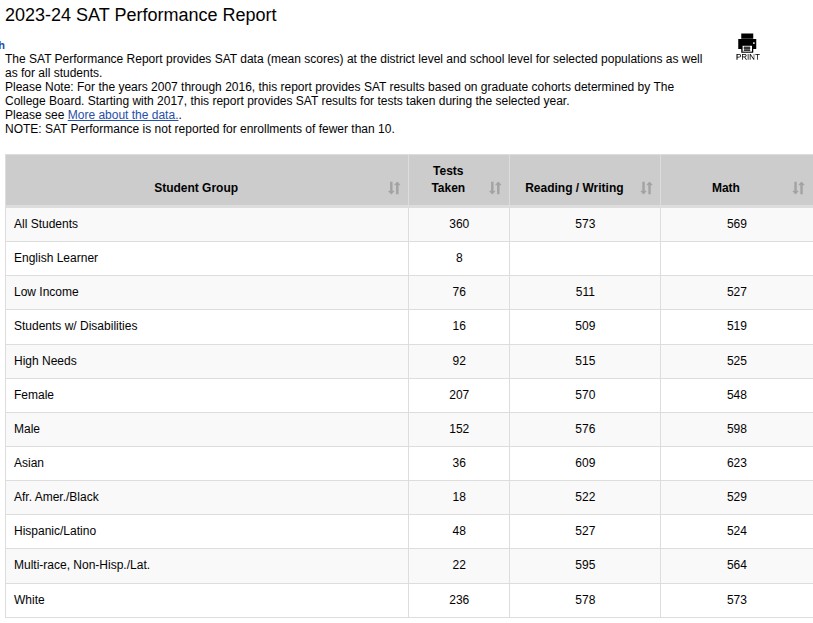
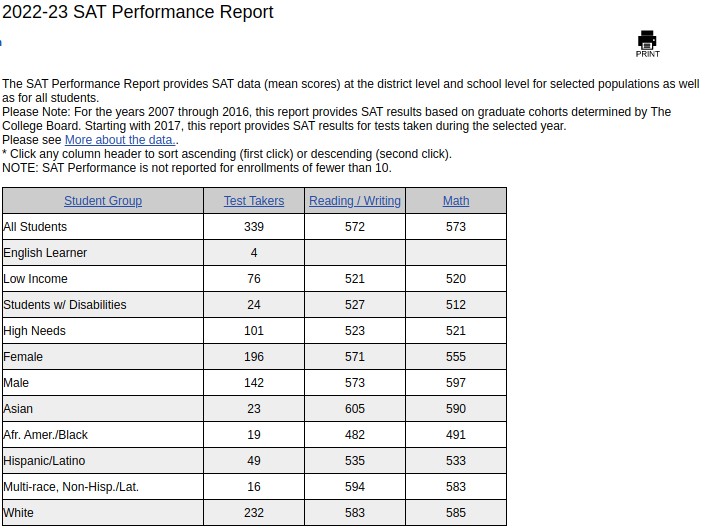
SAT scores for 2020
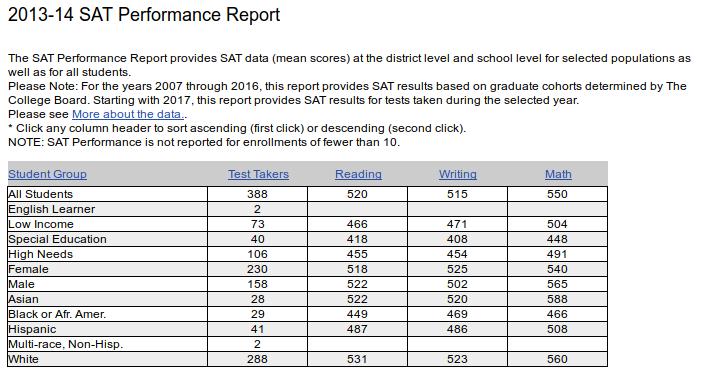
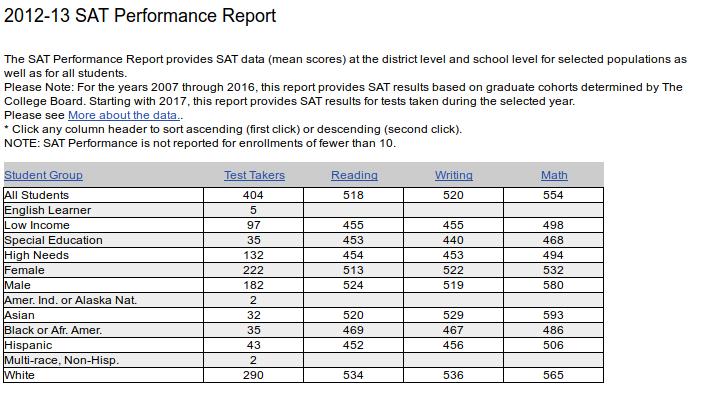
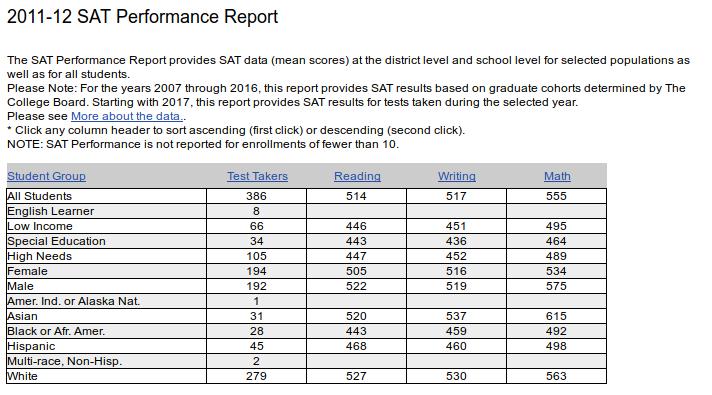
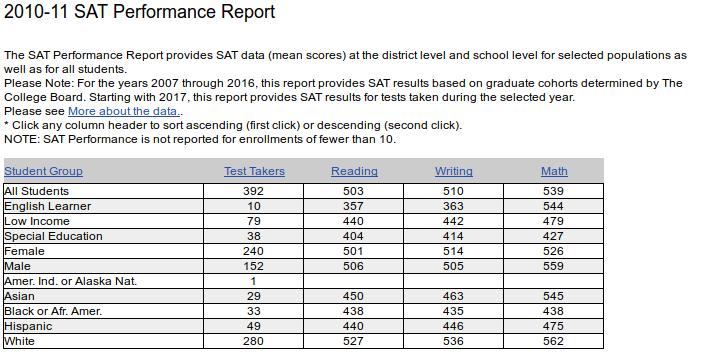
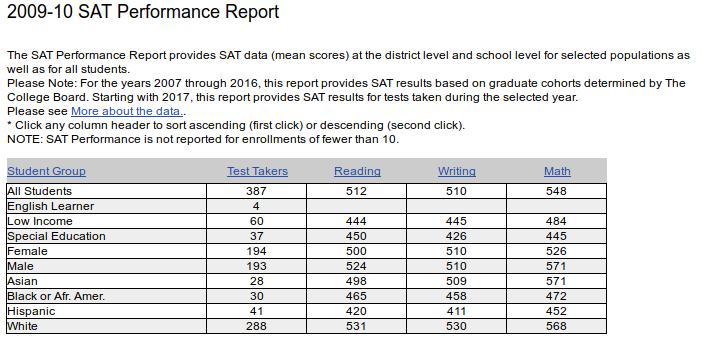
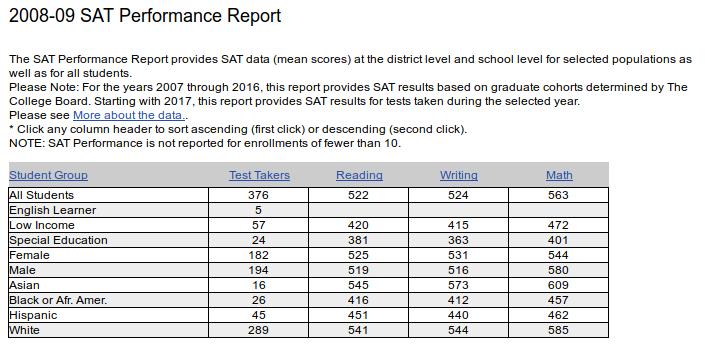
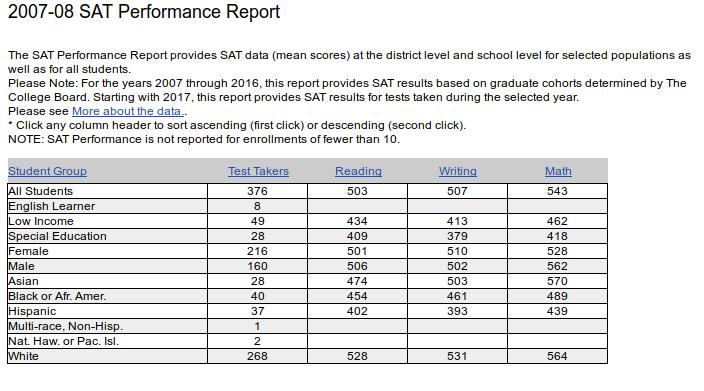
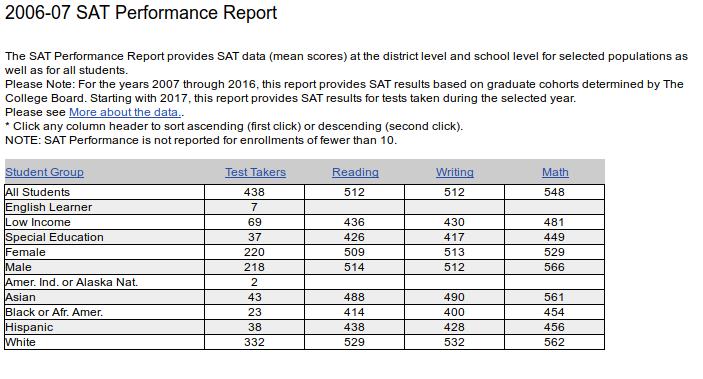
This web site has the historical scores for the Scholastic Aptitude Test (SAT) for Massachusetts. Examining page 3 of the Massachusetts report shows the trend in national scores from 1972 thru 2005. Note the Great Decline in verbal scores that started in the late 1960s. This represents the time frame during which the teachers were unionizing. In 1993, we were told that education reform would improve our schools. After funneling untold billions of our hard earned tax dollars into our schools, the SAT scores have declined. We were told that a smaller class size would improve results. After years of escalating school costs to decrease class size, the SAT scores have declined. After years of being told that new teaching methods by more senior (more costly) teachers would improve results, the SAT scores have declined. One striking correlation is SAT scores and family income. Higher income parents will motivate their children to their own levels. It's extremely difficult to rise above your culture. No educational system, no matter how it is designed, can make up for that which is not given to children in their homes. When the SAT scores go up, the teachers take credit, but when the SAT scores drop, they blame the students inabilities. The teachers can't have it both ways. Special Education started in 1973 and has yet to produce results. Nationwide, black students graduated at a rate of 69 percent; Hispanics graduated at 73 percent; whites graduated at a rate of 86 percent. |


|
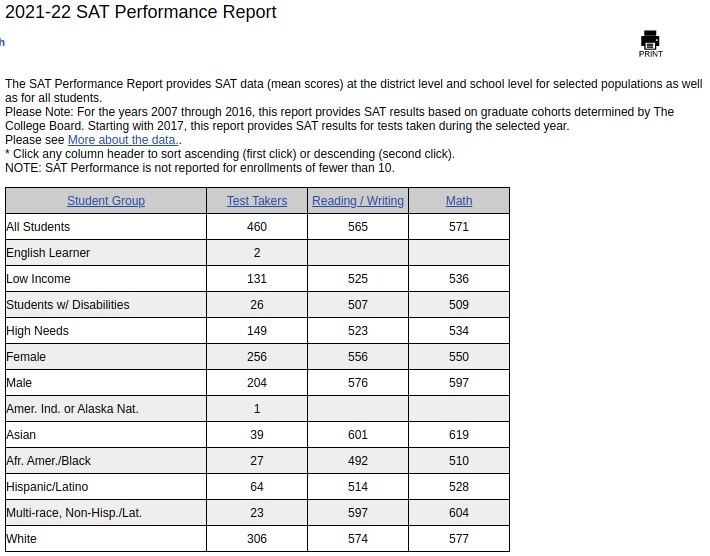
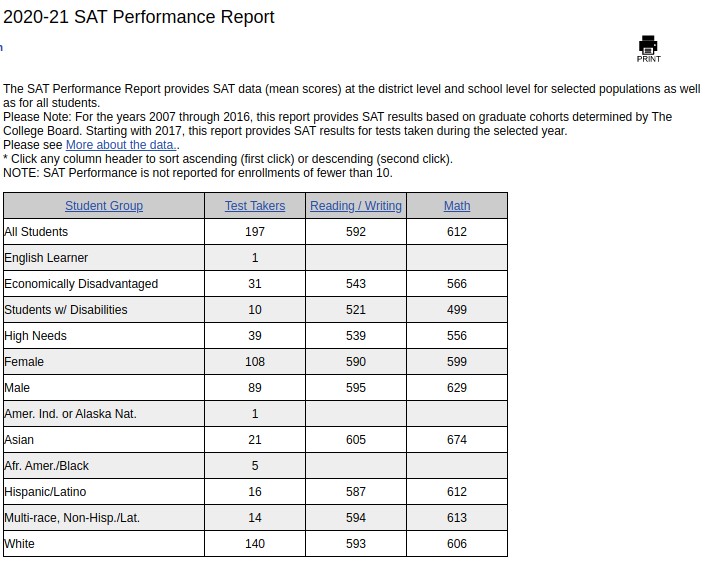
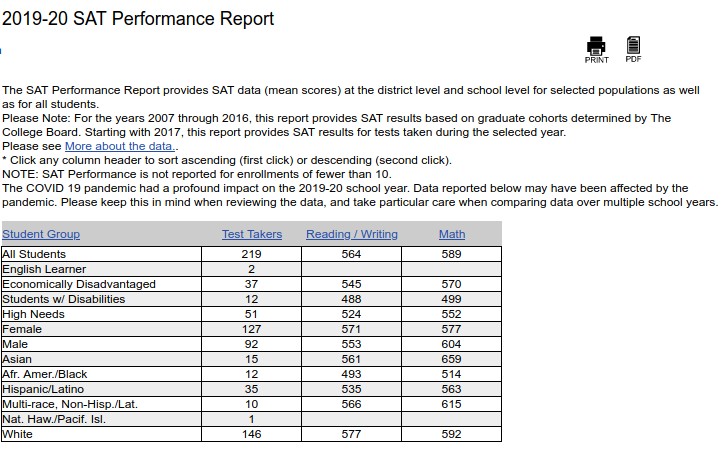
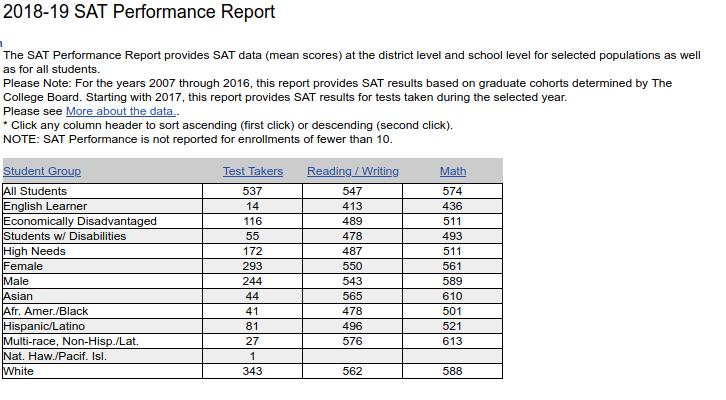
For those years that the SAT tests offered a Reading and Writing score
the Reading/Writing scores are added together and divided by 2. |
||||||||
|---|---|---|---|---|---|---|---|---|
| Year | Asians (Math) | Asians (Reading/ Writing) | Whites (Math) | Whites (Reading/ Writing) | Hispanic (Math) | Hispanic (Reading/ Writing) | Blacks (Math) | Blacks (Reading/ Writing) |
| 2024 | 609 | 623 | 578 | 573 | 527 | 524 | 522 | 529 |
| 2023 | 605 | 590 | 585 | 583 | 533 | 535 | 491 | 482 |
| 2022 | 619 | 601 | 577 | 574 | 528 | 514 | 510 | 492 |
| 2021 | 674 | 605 | 606 | 595 | 612 | 587 | ||
| 2020 | 659 | 561 | 592 | 577 | 563 | 535 | 514 | 493 |
| 2019 | 610 | 565 | 588 | 562 | 521 | 496 | 501 | 478 |
| 2018 | 643 | 589 | 597 | 569 | 521 | 491 | 512 | 489 |
| 2017 | 622 | 592 | 583 | 565 | 530 | 512 | 535 | 523 |
| 2016 | 569 | 526 | 579 | 538 | 500 | 446 | 460 | 440 |
| 2015 | 546 | 506 | 570 | 534 | 471 | 458 | 478 | 472 |
| 2014 | 588 | 521 | 560 | 527 | 508 | 487 | 466 | 459 |
| 2013 | 593 | 524 | 565 | 535 | 506 | 454 | 486 | 468 |
| 2012 | 615 | 529 | 563 | 528 | 498 | 464 | 492 | 451 |
| 2011 | 545 | 456 | 562 | 532 | 475 | 443 | 438 | 437 |
| 2010 | 571 | 504 | 568 | 530 | 452 | 416 | 472 | 462 |
| 2009 | 609 | 559 | 585 | 542 | 462 | 446 | 457 | 414 |
| 2008 | 570 | 489 | 564 | 530 | 439 | 397 | 489 | 458 |
| 2007 | 561 | 489 | 562 | 530 | 456 | 433 | 454 | 407 |
| Totals | 10809 | 9829 | 10384 | 9924 | 9102 | 8638 | 8277 | 7954 |
| Totals1 | 10135 | 9224 | 9778 | 9329 | 8490 | 8051 | 8277 | 7954 |
Totals simply adds the columns.
Totals1 simply adds the columns without 2021 numbers.
There were no blacks who took the SAT tests that year.
I think it would be useful if every student had to say whether they believe in god or not (ATHEIST).

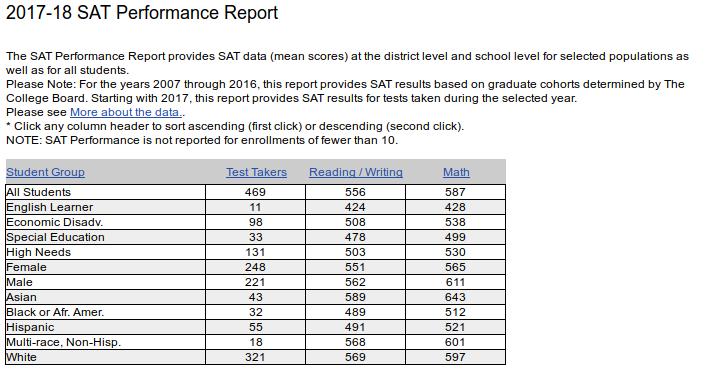
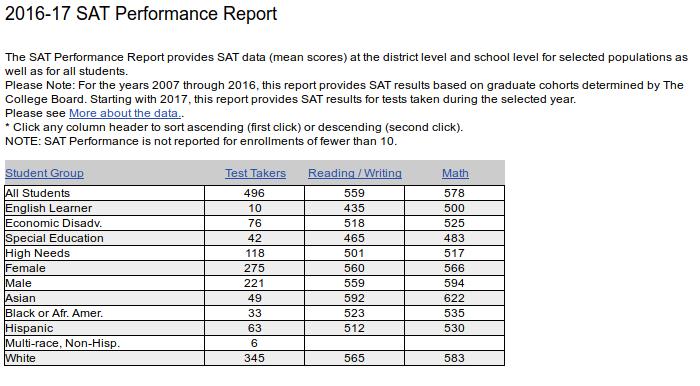
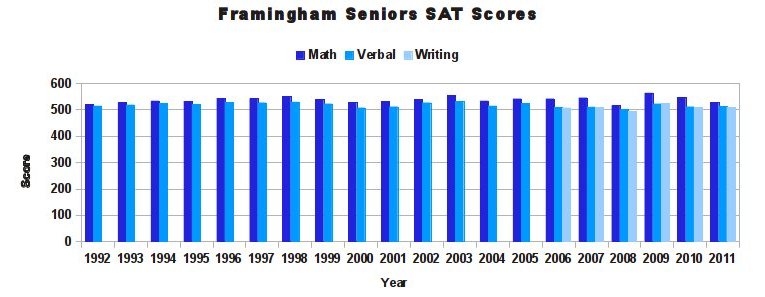
| SAT Scores for Framingham Seniors | |||||
|---|---|---|---|---|---|
| Year | Verbal | Math | Writing | Total Verbal Math | Total Verbal Math Writing |
| 2018 | 556 | 586 | 1142 | 1142 | |
| 2017 | 556 | 587 | 1143 | 1143 | |
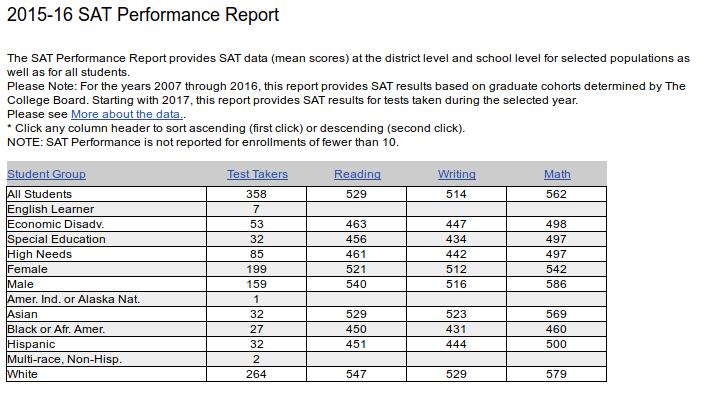
| 2016 | 559 | 578 | 1137 | 1137 | |
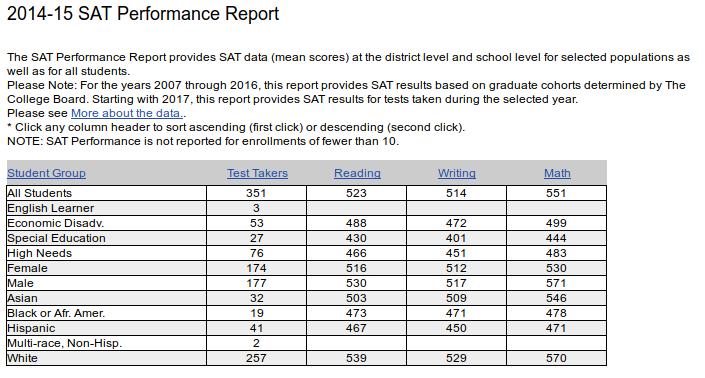
| 2015 | 529 | 562 | 514 | 1091 | 1605 |
| 2014 | 523 | 551 | 514 | 1074 | 1588 |
| 2013 | 517 | 552 | 519 | 1069 | 1588 |
| 2012 | 512 | 552 | 515 | 1067 | 1579 |
| 2011 | 513 | 527 | 509 | 1040 | 1549 |
| 2010 | 511 | 547 | 509 | 1056 | 1567 |
| 2009 | 522 | 563 | 524 | 1085 | 1609 |
| 2008 | 501 | 515 | 494 | 1016 | 1510 |
| 2007 | 510 | 545 | 509 | 1055 | 1564 |
| 2006 | 509 | 541 | 507 | 1050 | 1557 |
| 2005 | 524 | 541 | 1065 | 1065 | |
| 2004 | 514 | 533 | 1047 | 1047 | |
| 2003 | 531 | 554 | 1085 | 1085 | |
| 2002 | 526 | 538 | 1064 | 1064 | |
| 2001 | 511 | 533 | 1044 | 1044 | |
| 2000 | 507 | 528 | 1035 | ||
| 1999 | 522 | 539 | 1061 | 1061 | |
| 1998 | 529 | 549 | 1078 | 1078 | |
| 1997 | 526 | 542 | 1068 | 1068 | |
| 1996 | 528 | 543 | 1071 | 1071 | |
| 1995 | 520 | 531 | 1051 | 1051 | |
| 1994 | 523 | 533 | 1056 | 1056 | |
| 1993 | 518 | 528 | 1046 | 1046 | |
| 1992 | 514 | 519 | 1033 | 1033 | |
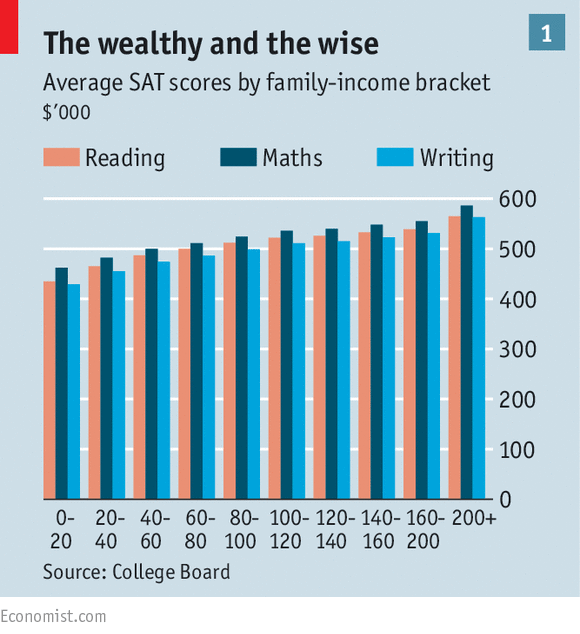
| Not only do graduate couples tend to value education; they also tend to have money to spend on it. And though the best predictor of an American child's success in school has long been the parents' educational level - a factor which graduates are already ahead on, by defintition - money is an increasingly important factor. According to Sean Reardon of Stanford the past decades have seen a growing correlation between parental income and children's test scores. Sort the students who took the SAT, a test for college applicants, in 2014 by parental income and the results get steadily better the further up the ladder you climb |
| 2006 SAT Scores | ||||
|---|---|---|---|---|
| Town | Reading Verbal | Math | Writing | Total |
| Wellesley | 615 | 634 | 621 | 1870 |
| Weston | 604 | 626 | 609 | 1839 |
| Wayland | 596 | 624 | 599 | 1819 |
| Dover-Sherborn | 605 | 619 | 594 | 1818 |
| Newton South | 593 | 617 | 598 | 1808 |
| Newton North | 579 | 598 | 585 | 1762 |
| Lincoln-Sudbury | 579 | 601 | 576 | 1756 |
| Needham | 582 | 588 | 578 | 1748 |
| Medfield | 582 | 574 | 578 | 1734 |
| Holliston | 556 | 591 | 561 | 1708 |
| Westborough | 559 | 588 | 556 | 1703 |
| Nashoba Regional | 559 | 562 | 552 | 1673 |
| Algonquin Regional | 543 | 563 | 551 | 1657 |
| King Philip Regional | 543 | 548 | 545 | 1636 |
| Hopkinton | 542 | 551 | 536 | 1629 |
| Franklin | 532 | 540 | 540 | 1612 |
| Tahanto Regional | 538 | 536 | 522 | 1596 |
| Natick | 530 | 537 | 526 | 1593 |
| Shrewsbury | 521 | 537 | 518 | 1576 |
| Ashland | 521 | 536 | 511 | 1568 |
| Medway | 515 | 532 | 514 | 1561 |
| Marlborough | 518 | 534 | 509 | 1561 |
| Framingham | 509 | 541 | 507 | 1557 |
| Hudson | 507 | 535 | 513 | 1555 |
| Nipmuc Regional-Middle | 519 | 517 | 512 | 1548 |
| Millis | 505 | 502 | 506 | 1513 |
| Watertown | 492 | 521 | 496 | 1509 |
| Milford | 496 | 515 | 497 | 1508 |
| Maynard | 500 | 491 | 475 | 1466 |
| Bellingham | 484 | 482 | 470 | 1436 |
| Minuteman Regional | 483 | 490 | 452 | 1425 |
| Tri-County Regional Vocational | 471 | 485 | 461 | 1417 |
| Norfolk County Agricultural | 471 | 469 | 446 | 1386 |
| Blackstone Valley Regional Vocational | 452 | 451 | 431 | 1334 |
| Assabet Valley Regional | 441 | 452 | 417 | 1310 |
| J.P. Keefe Technical | 443 | 409 | 397 | 1249 |
| Massachusetts Average | 513 | 524 | 510 | 1547 |
| U.S. National Average | 503 | 518 | 497 | 1524 |
| 2000 SAT Scores | |||
|---|---|---|---|
| Town | Verbal | Math | Total |
| Westborough | 597 | 622 | 1219 |
| Holliston | 556 | 572 | 1128 |
| Northboro | 543 | 568 | 1111 |
| Southboro | 543 | 568 | 1111 |
| Natick | 545 | 534 | 1079 |
| Ashland | 531 | 541 | 1072 |
| Hopkinton | 535 | 532 | 1067 |
| Marlboro | 516 | 524 | 1040 |
| Framingham | 507 | 528 | 1035 |
Send comments to:
 hjw2001@gmail.com
|

|