


|
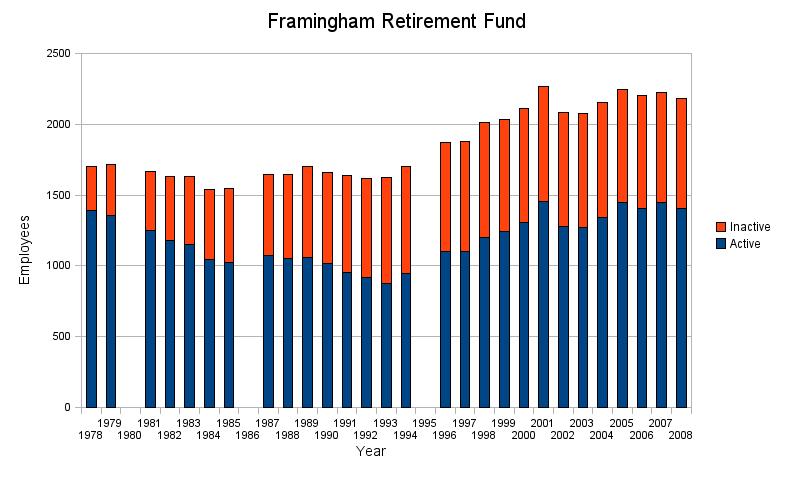
Town of Framingham Retirement Fund
Public Employee Retirement Administration Commission
The table below was data accumulated from annual reports. | ||||||
|---|---|---|---|---|---|---|
| Year | Contributions | Amount in fund | Total Members | Active Members | Inactive Members | Retired Members |
| 1975 | 866,000 | 6,627,307 | ||||
| 1976 | 1,024,600 | 7,640,358 | ||||
| 1977 | 1,453,600 | 8,671,541 | 1,760 | |||
| 1978 | 1,390,800 | 9,600,000 | 1,704 | 1,394 | 310 | |
| 1979 | 1,451,687 | 10,000,000 | 1,717 | 1,357 | 360 | |
| Year | Contributions | Amount in fund | Total Members | Active Members | Inactive Members | Retired Members |
| 1980 | 1,971,555 | 11,868,133 | ||||
| 1981 | 2,300,241 | 12,000,000 | 1,668 | 1,246 | 422 | |
| 1982 | 2,304,116 | 14,978,115 | 1,633 | 1,178 | 455 | |
| 1983 | 2,660,919 | 16,984,359 | 1,632 | 1,147 | 485 | |
| 1984 | 2,963,060 | 18,233,989 | 1,540 | 1,041 | 499 | |
| 1985 | 3,269,951 | 21,646,125 | 1,545 | 1,026 | 519 | |
| 1986 | 3,295,772 | |||||
| 1987 | 3,303,956 | 26,953,222 | 1,645 | 1,072 | 573 | |
| 1988 | 3,334,088 | 26,561,411 | 1,646 | 1,048 | 598 | |
| 1989 | 3,694,028 | 32,715,096 | 1,699 | 1,061 | 638 | |
| Year | Contributions | Amount in fund | Total Members | Active Members | Inactive Members | Retired Members |
| 1990 | 4,271,394 | 35,628,547 | 1,659 | 1,016 | 643 | |
| 1991 | 4,562,690 | 46,527,043 | 1,636 | 955 | 681 | |
| 1992 | 5,202,479 | 48,220,457 | 1,616 | 915 | 701 | |
| 1993 | 5,729,799 | 58,903,314 | 1,626 | 877 | 749 | |
| 1994 | 5,971,974 | 54,906,319 | 1,703 | 948 | 755 | |
| 1995 | 7,881,211 | |||||
| 1996 | 6,682,933 | 85,040,498 | 1,873 | 1,100 | 773 | |
| 1997 | 6,627,203 | 105,937,243 | 1,871 | 1,100 | 781 | |
| 1998 | 6,652,682 | 126,733,190 | 1,873 | 1,200 | 809 | |
| 1999 | 6,844,917 | 147,571,369 | 2,032 | 1,239 | 793 | |
| Year | Contributions | Amount in fund | Total Members | Active Members | Inactive Members | Retired Members |
| 2000 | 6,851,337 | 137,890,627 | 2,108 | 1,305 | 803 | |
| 2001 | 6,240,352 | 129,910,753 | 2,266 | 1,453 | 813 | |
| 2002 | 6,503,587 | 112,684,332 | 2,081 | 1,281 | 800 | |
| 2003 | 6,784,750 | 138,335,983 | 2,078 | 1,268 | 810 | |
| 2004 | 7,183,953 | 154,981,950 | 2,153 | 1,338 | 815 | |
| 2005 | 7,579,461 | 171,407,017 | 2,248 | 1,446 | 802 | |
| 2006 | 7,928,181 | 197,768,747 | 2,201 | 1,407 | 794 | |
| 2007 | 8,309,783 | 217,975,543 | 2,227 | 1,447 | 780 | |
| 2008 | 8,983,361 | 151,341,614 | 2,184 | 1,404 | 780 | |
| 2009 | 9,419,974 | 174,744,878 | 2,186 | 1,408 | 778 | |
| Year | Contributions | Amount in fund | Total Members | Active Members | Inactive Members | Retired Members |
| 2010 | 9,968,614 | 195,532,400 | 2,110 | 1,321 | 789 | |
| 2011 | 10,207,621 | 191,234,650 | 2,172 | 1,132 | 814 | |
| 2012 | 10,338,095 | 214,950,930 | 2,177 | 1,125 | 255 | 797 |
| 2013 | 12,279,663 | 243,198,754 | 2,238 | 1,175 | 247 | 816 |
| 2014 | 11,998,971 | 243,815,884 | 2,167 | 1,130 | 270 | 767 |
| 2015 | 11,845,227 | 258,418,879 | 2,255 | 1,151 | 308 | 796 |
| 2016 | 2,339,537 | 255,278,200 | 2,351 | 1,205 | 331 | 815 |

| Framingham population (U.S. Census Bureau) | |
|---|---|
| Year | Population |
| 1960 | 44,562 |
| 1970 | 64,068 |
| 1980 | 65,113 |
| 1990 | 64,989 |
| 2000 | 66,910 |
| 2007 | 64,786 |
| 2010 | 68,050 |
Click on graph below to see associated data
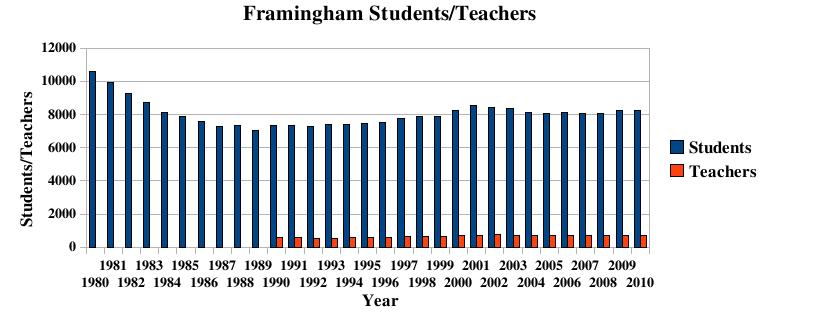

| The Framingham retirement fund does not include teachers.
A member is vested after 10 years, meaning that they will get
some payments for life. If you quit before 10 years, you can
either get a refund of your contributions or you can transfer them
to another town where you gained employment.
An active member is employed by town of Framingham and contributing. An inactive member is one who has quit Framingham (and may come back) but has not requested a refund on his/her contributions. On June 29, 2010, I requested that the annual report provide a breakdown between active, inactive, and retired personnel. As of 2010, the retirement fund is 75% funded. In 2004, the retirement fund was 67.3 percent funded. This means that $154,981,950 represents 67.3%, so full funding would be something close to $230,285,215. This means we are only $75,303,265 in the hole. State law requires that it be fully funded by 2027. Increasing the annual funding will diminish funds for operations. As of December 2008, the retirement fund took a big plunge and now stands at $151,341,614 on December 31, 2008. This leaves us with an approximate $85,000,000 shortfall. Current actuarial tables require a 4% hike year over year, but with the sharp fall in 2008, that will have to be increased (accelerated). |
Send comments to:
 hjw2001@gmail.com
|
|
|