
|
Every tax is a pay cut. Every tax cut is a pay raise. |

|

|
Joseph P Keefe Technical High School
750 Winter Street Framingham, MA 01702 508-416-2100 Also known as the South Middlesex Vocational Technical School Keefe Tech profile |
|---|

This school for morons is on the cusp of being a complete, total and systemic failure as an educational institution. The instructors pretend to teach and the students pretend to learn. The lalaland liberals and neolibs are so giddy about it and claim that it's not an academic school but fail to provide any evidence that it is good at anything that it allegedly teaches. How do you measure an educational institution if all measurements of education are in the failure range. Now at 45% SPED, but taxpayers will have to make their own decision as to how high this rate should go before they realize that they are being fleeced by the teachers unions using SPED to decrease class sizes and increase their numbers. Is SPED effective in any way? Why do we spend proportionately more for students with less potential? $25,000 per year is more than most colleges. The school's objective here is to maximize retardation capabilities and produce what the politically correct crowd might describe as minimally exceptional students. Failure is the only option.Keefe Tech students are generally slower than molasses runing up hill. AARP could mean Association For the Advancement of Retarded People
Keefe Tech is a school whose's academics have hit rock bottom but I am convinced that the Keefe Tech School Committee with their cocaine addict member will provide the students with jack hammers so that they can continue to dig deeper. This school should have more slow children signs around it.
Sixty percent (60%) of Keefe Tech students get free or reduced lunch. It's really a welfare school for illiterates, run by highly paid idiots. |


|
Selected Populations by race at Keefe Tech (South Middlesex Vocational School)
Selected Populations by Race/Enrollment by grade Enrollment by Grade, all schools Selected Population by language/income
| ||||||||||||
|---|---|---|---|---|---|---|---|---|---|---|---|---|
| First Language Not English | Limited English Proficient | Special Education | Low Income | Per Pupil Expenditures | ||||||||
| Year | Total Enrollment | Number | % | Number | % | Number | % | Number | % | Regular | SPED | Bilingual |
| 1991-1992 | 223 | 30.1 | 53 | 7.2 | 75 | 10.1 | ||||||
| 1992-1993 | 199 | 27.0 | 55 | 7.5 | 260 | 35.3 | 221 | 30.0 | ||||
| 1993-1994 | 724 | 194 | 26.8 | 38 | 5.2 | 236 | 32.6 | 191 | 26.4 | |||
| 1994-1995 | 710 | 235 | 33.1 | 34 | 4.8 | 230 | 32.4 | 198 | 27.9 | |||
| 1995-1996 | 731 | 280 | 38.3 | 191 | 26.1 | 239 | 32.7 | 172 | 23.5 | $14,169 | ||
| 1996-1997 | 802 | 303 | 37.8 | 38 | 4.7 | 270 | 33.7 | 253 | 31.5 | $14,698 | ||
| 1997-1998 | 785 | 217 | 27.6 | 41 | 5.2 | 308 | 39.2 | 192 | 24.4 | $14,903 | ||
| 1998-1999 | 780 | 293 | 37.6 | 105 | 13.5 | 297 | 38.1 | 282 | 36.2 | $15,964 | ||
| 1999-2000 | 763 | 188 | 24.6 | 54 | 7.1 | 289 | 37.9 | 235 | 30.8 | $18,209 | ||
| 2000-2001 | 749 | 243 | 32.4 | 84 | 11.2 | 291 | 38.9 | 233 | 31.1 | $17,251 | ||
| 2001-2002 | 760 | 210 | 27.6 | 83 | 10.9 | 279 | 36.7 | 265 | 34.9 | $17,346 | ||
| 2002-2003 | 769 | 180 | 23.4 | 94 | 12.2 | 276 | 35.9 | 291 | 37.8 | $18,672 | ||
| 2003-2004 | 735 | 132 | 18.0 | 60 | 8.2 | 305 | 41.5 | 279 | 38.0 | $20,103 | ||
| 2004-2005 | 744 | 110 | 14.8 | 54 | 7.3 | 307 | 41.3 | 295 | 39.7 | $20,412 | ||
| 2005-2006 | 717 | 72 | 10.0 | 43 | 6.0 | 298 | 41.6 | 290 | 40.4 | |||
| 2006-2007 | 717 | 74 | 10.4 | 39 | 5.5 | 299 | 42.0 | 304 | 42.7 | |||
| 2007-2008 | 717 | 73 | 10.9 | 53 | 7.9 | 266 | 39.7 | 295 | 44.0 | |||
| Year | Total Students | Teachers | FT Employees | PT Employees | Student/Teacher Ratio | Student/FT Employee Ratio |
|---|---|---|---|---|---|---|
| 2005 | 742 | 86 | 144 | 3 | 8.6 | 5.1 |
| Profiles (all schools) | ||||||
|---|---|---|---|---|---|---|
| Year | Framingham Students | Framingham Contribution ($ millions) | Framingham Per Pupil Costs ($) | Total Students | Total Costs ($ millions) | Total Per Pupil Costs ($) |
| 1990 | 475 | 3.379 | 7,113 | 745 | ||
| 1991 | 515 | 3.590 | 6,970 | 725 | ||
| 1992 | 513 | 3.647 | 7,109 | 632 | ||
| 1993 | 487 | 4.139 | 8,498 | 624 | ||
| 1994 | 505 | 4.298 | 8,510 | 615 | ||
| 1995 | 532 | 4.472 | 8,406 | 623 | ||
| 1996 | 551 | 4.767 | 8,651 | 728 | 8.972 | 14,309 |
| 1997 | 588 | 5.249 | 8,926 | 760 | 9.569 | 13,271 |
| 1998 | 570 | 5.258 | 9,224 | 773 | 10.211 | 14,261 |
| 1999 | 548 | 6.067 | 11,071 | 767 | 10.676 | 14,624 |
| 2000 | 516 | 6.284 | 12,178 | 682 | 11.470 | 16,223 |
| 2001 | 516 | 6.371 | 12,346 | 788 | 11.705 | 16,211 |
| 2002 | 531 | 6.359 | 11,975 | 781 | 12.109 | 15,932 |
| 2003 | 511 | 6.302 | 12,332 | 754 | 12.564 | 16,402 |
| 2004 | 534 | 6.776 | 12,689 | 704 | 12.695 | 17,342 |
| 2005 | 529 | 6.792 | 12,839 | 706 | 15.568 | 22,035 |
| 2006 | 532 | 6.996 | 13,150 | 672 | 15.937 | 23,716 |
| 2007 | 532 | 7.900 | 13,150 | 678 | 16.803 | 24,772 |
| 2008 | 507 | 8.188 | 13,150 | 670 | ||
| If this school wasn't retarded enough, they also hold some
interesting evening classes for Framingham residents who wish
to learn mostly obvious stuff. These two classes indicate the
educational character of this school.

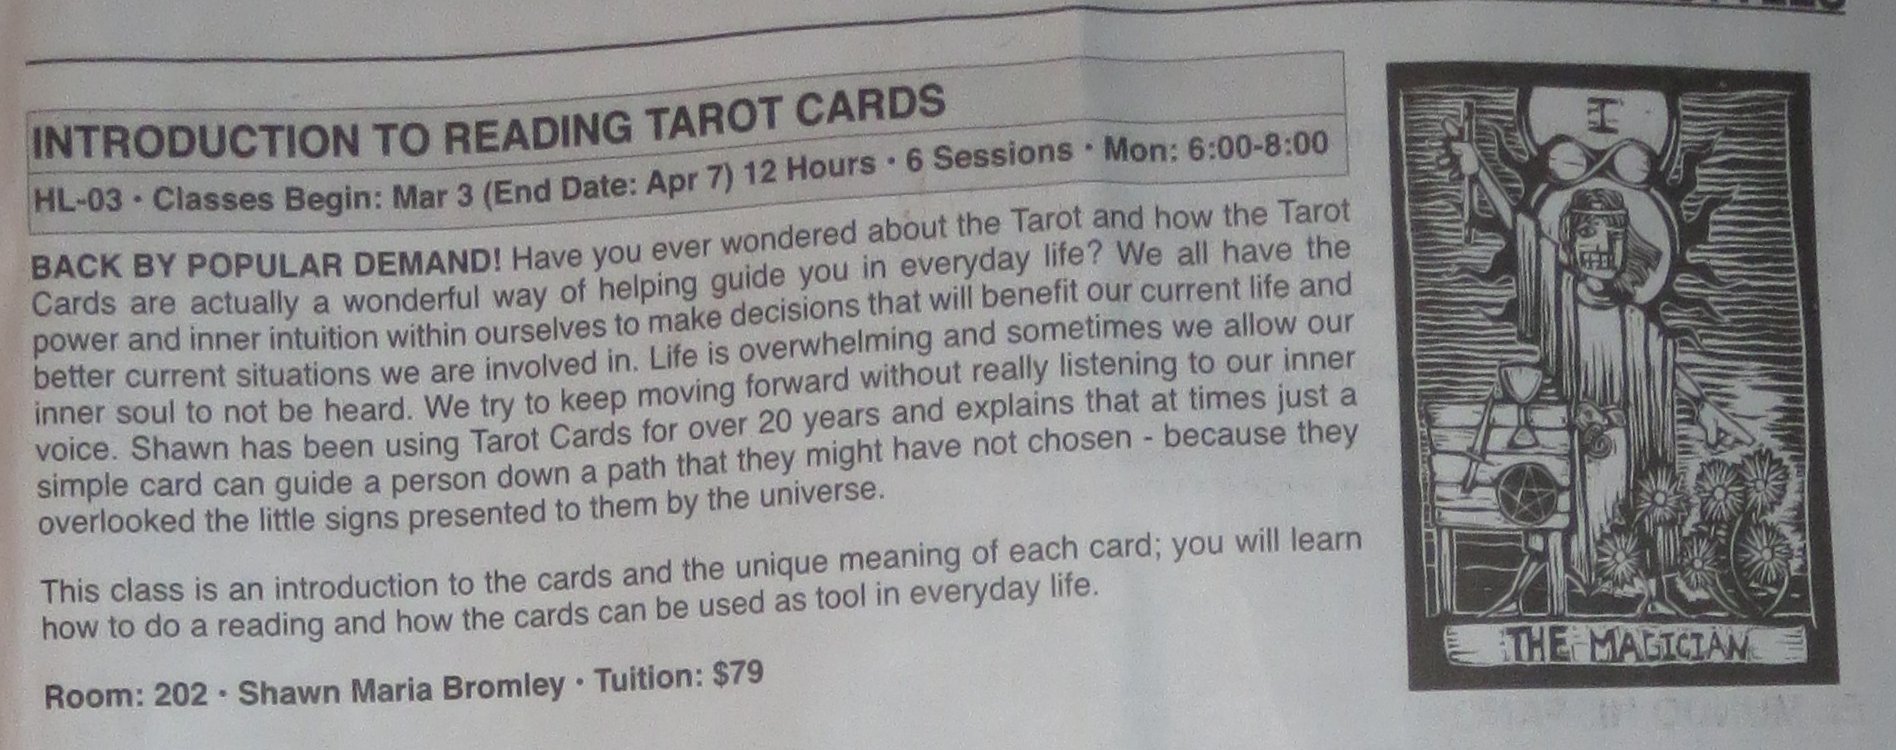
The notion that these courses actually show up in their catalog is stunning and shows the intellectualism ( or lack thereof) of this school. They offer you the opportunity (at a small fee) to learn something that is complete and total bullshit. |
Send comments to:
 hjw2001@gmail.com
|

|